What Anaplan does
Anaplan is a planning tool for large businesses. Businesses use it to build models that help them forecast what would happen in different scenarios.
Who I worked with
I was the lead designer, working with other designers, a researcher, several product managers and several engineering teams. I focused on the core part of the product, and made sure the surrounding parts, which other designers owned, were consistent with each other and with the core.
Customers’ data had to leave Anaplan to be moved
Anaplan is a data modelling product, so customers needed to bring in data from many separate systems and, once it was processed, push it out to other systems. To do this, it relied on third-party ETL (extract, transform, load) tools to handle the data movement.
This worked to an extent, but the tools weren’t native to the Anaplan ecosystem, which made for a poor experience for users. As a result, a project was launched to build Anaplan’s own ETL tool.
- Source systems
- Third-party ETL tool
- Anaplan
- Third-party ETL tool
- Other systems
Three things shaped the design
Designing for IT and business users
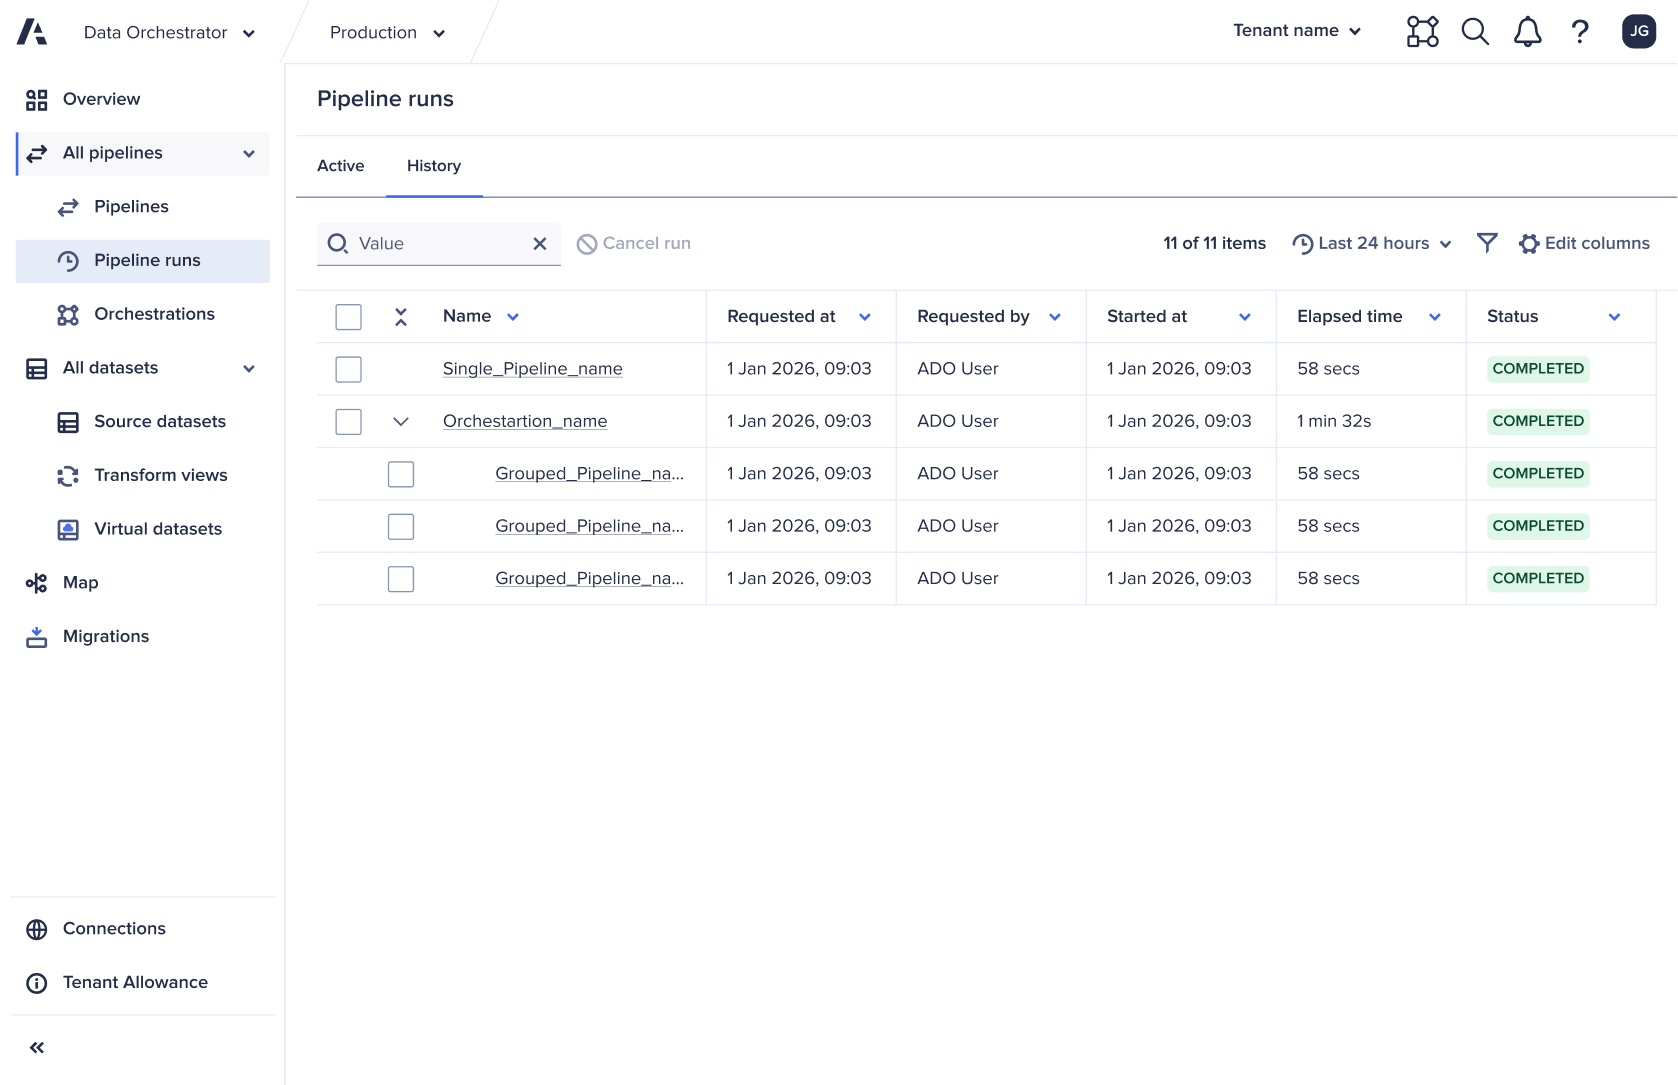
Research showed that Anaplan customers had no single way of sourcing and transforming data. Some needed extensive IT solutions, handled by IT specialists. Others relied on ad-hoc processes carried out by business specialists, such as HR managers or data analysts.
So the product had to work for both. I made sure it was easy to use for people who weren’t technically minded, while technical users could still apply their existing knowledge to build custom solutions.
Building on industry standards
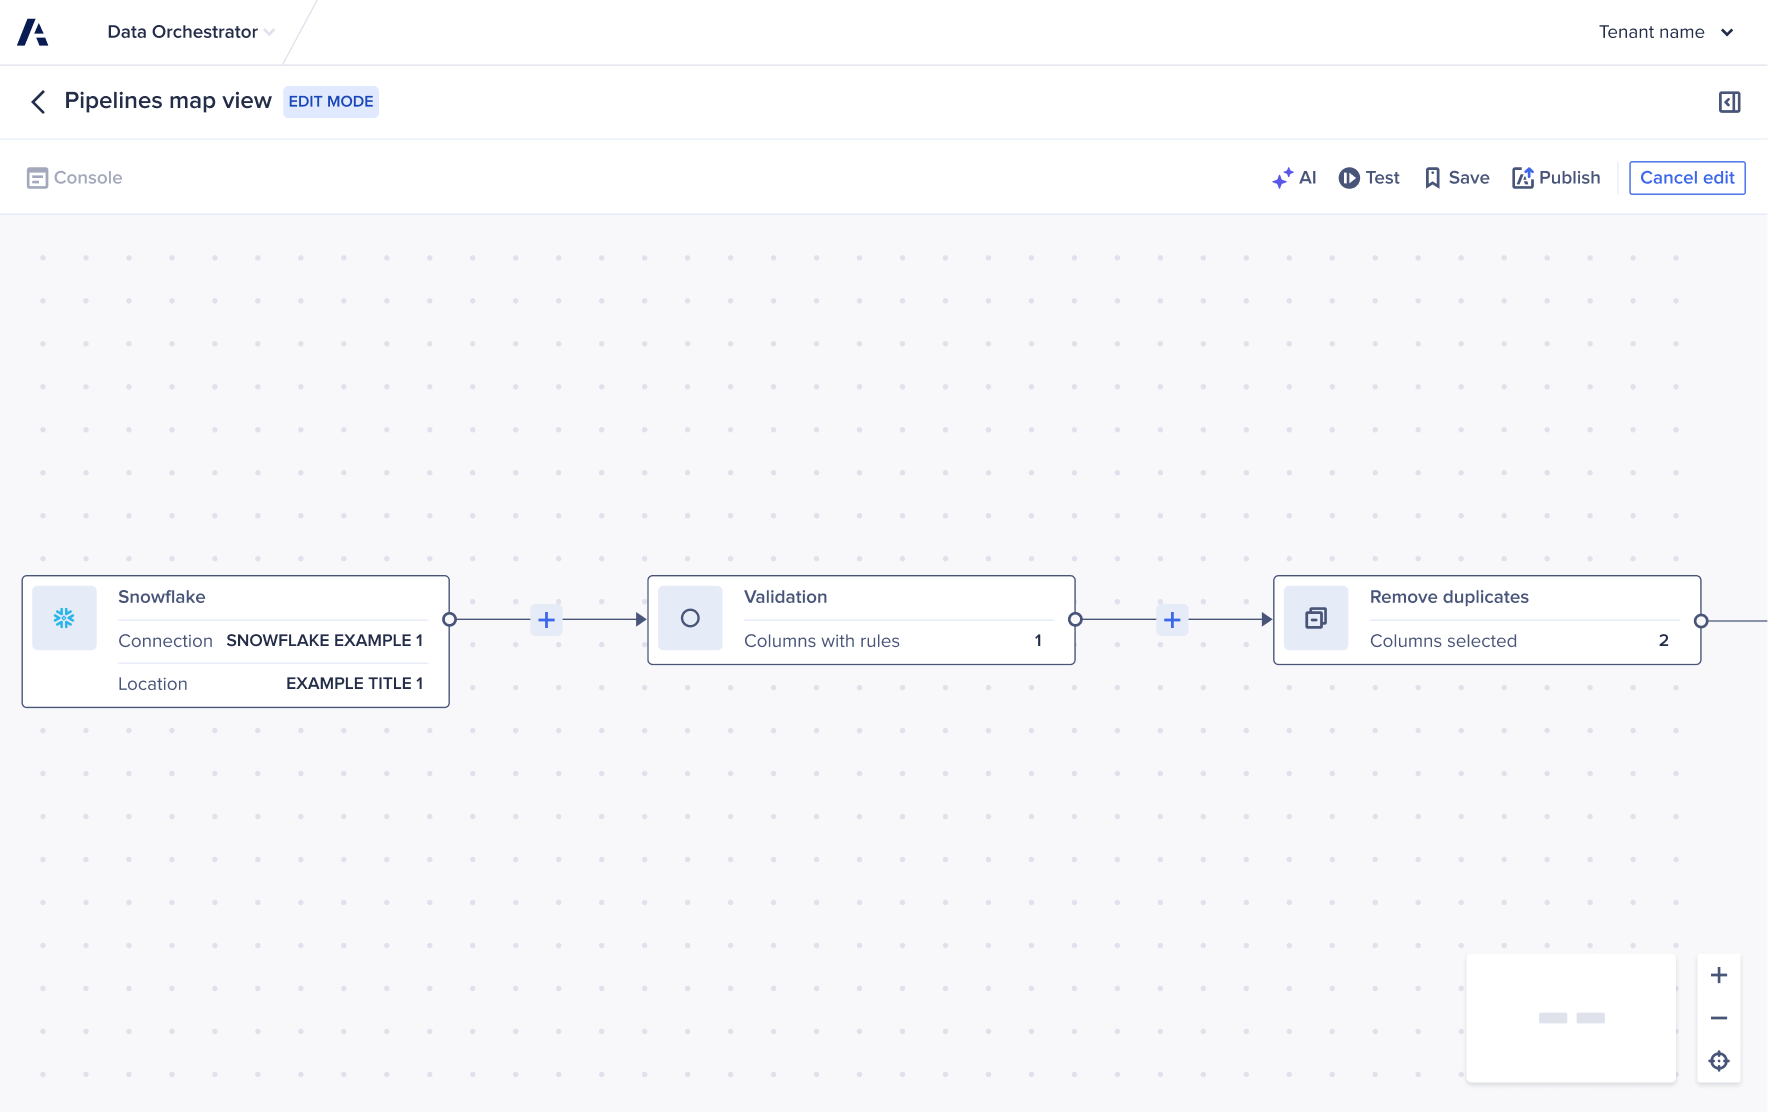
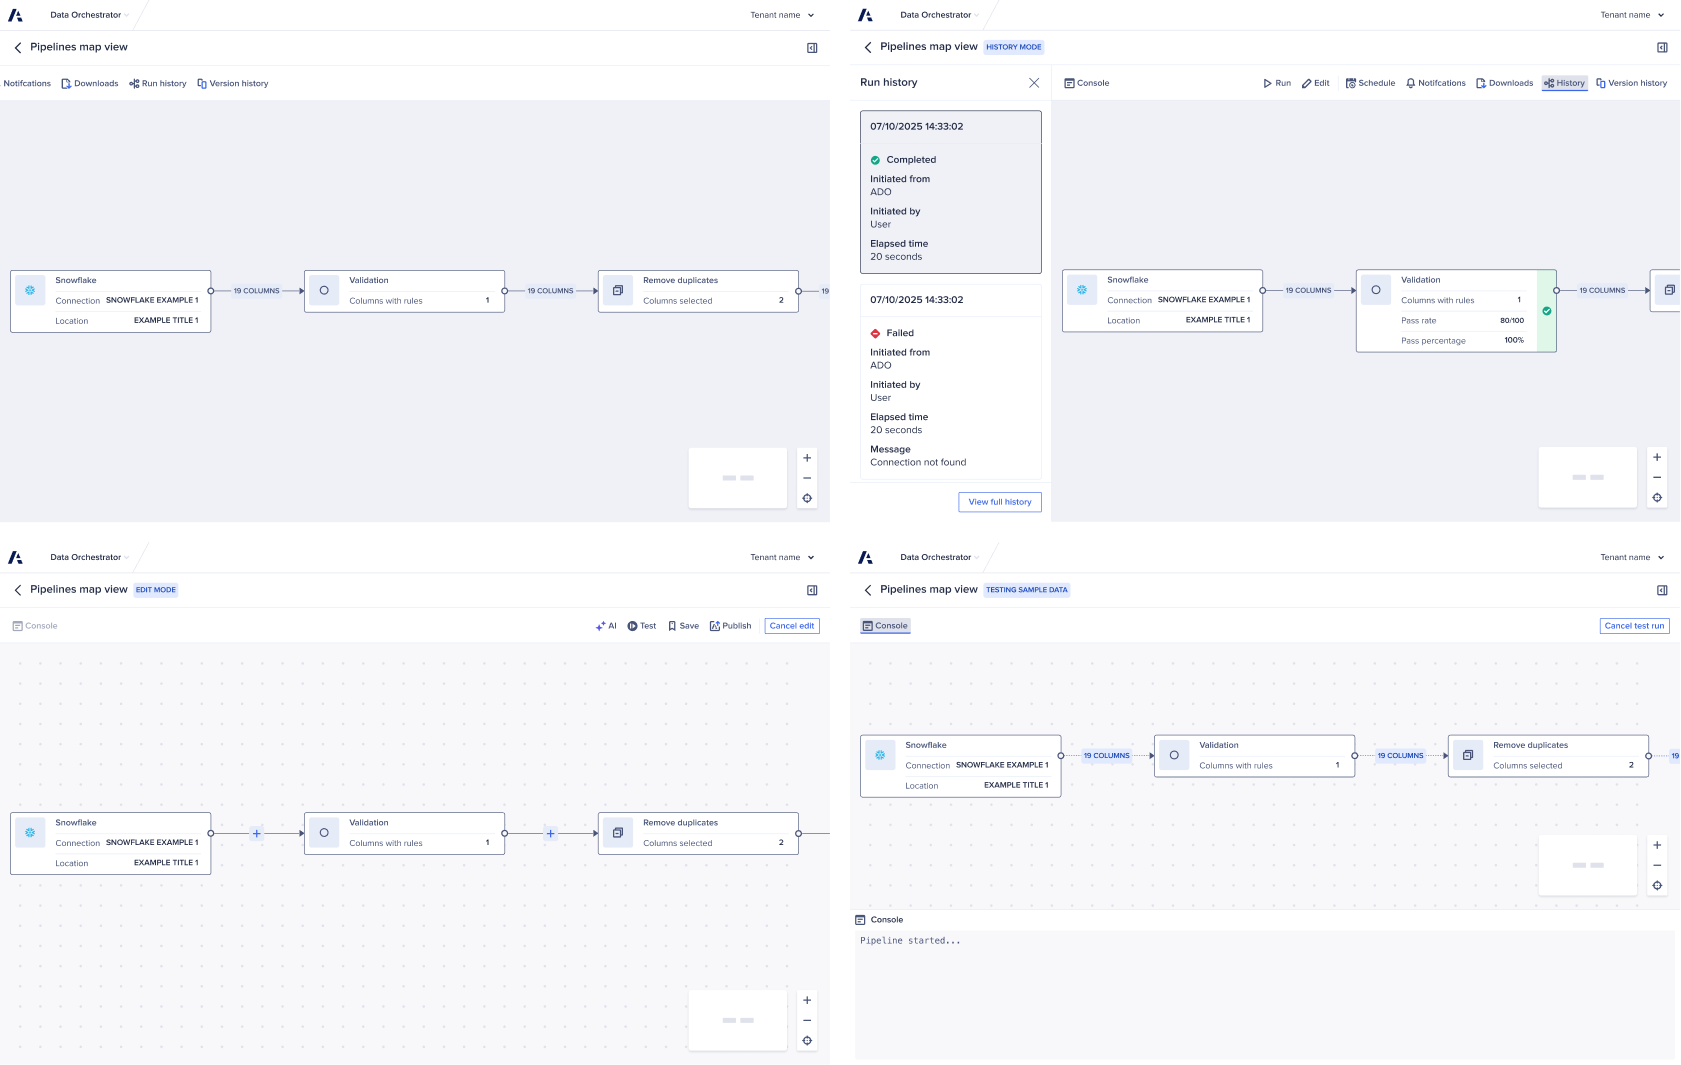
Our customers already used ETL tools, and had picked up certain behaviours and ways of working from them. For them to pick up Anaplan’s solution easily, I couldn’t design something from scratch. I had to use the standards that already existed and the language our customers already used.
To do this, I researched existing tools in depth and worked with a researcher to interview customers about their current processes. I also reviewed Anaplan’s content guidelines to write copy that followed them while still being familiar to our customers.
Leading across multiple teams
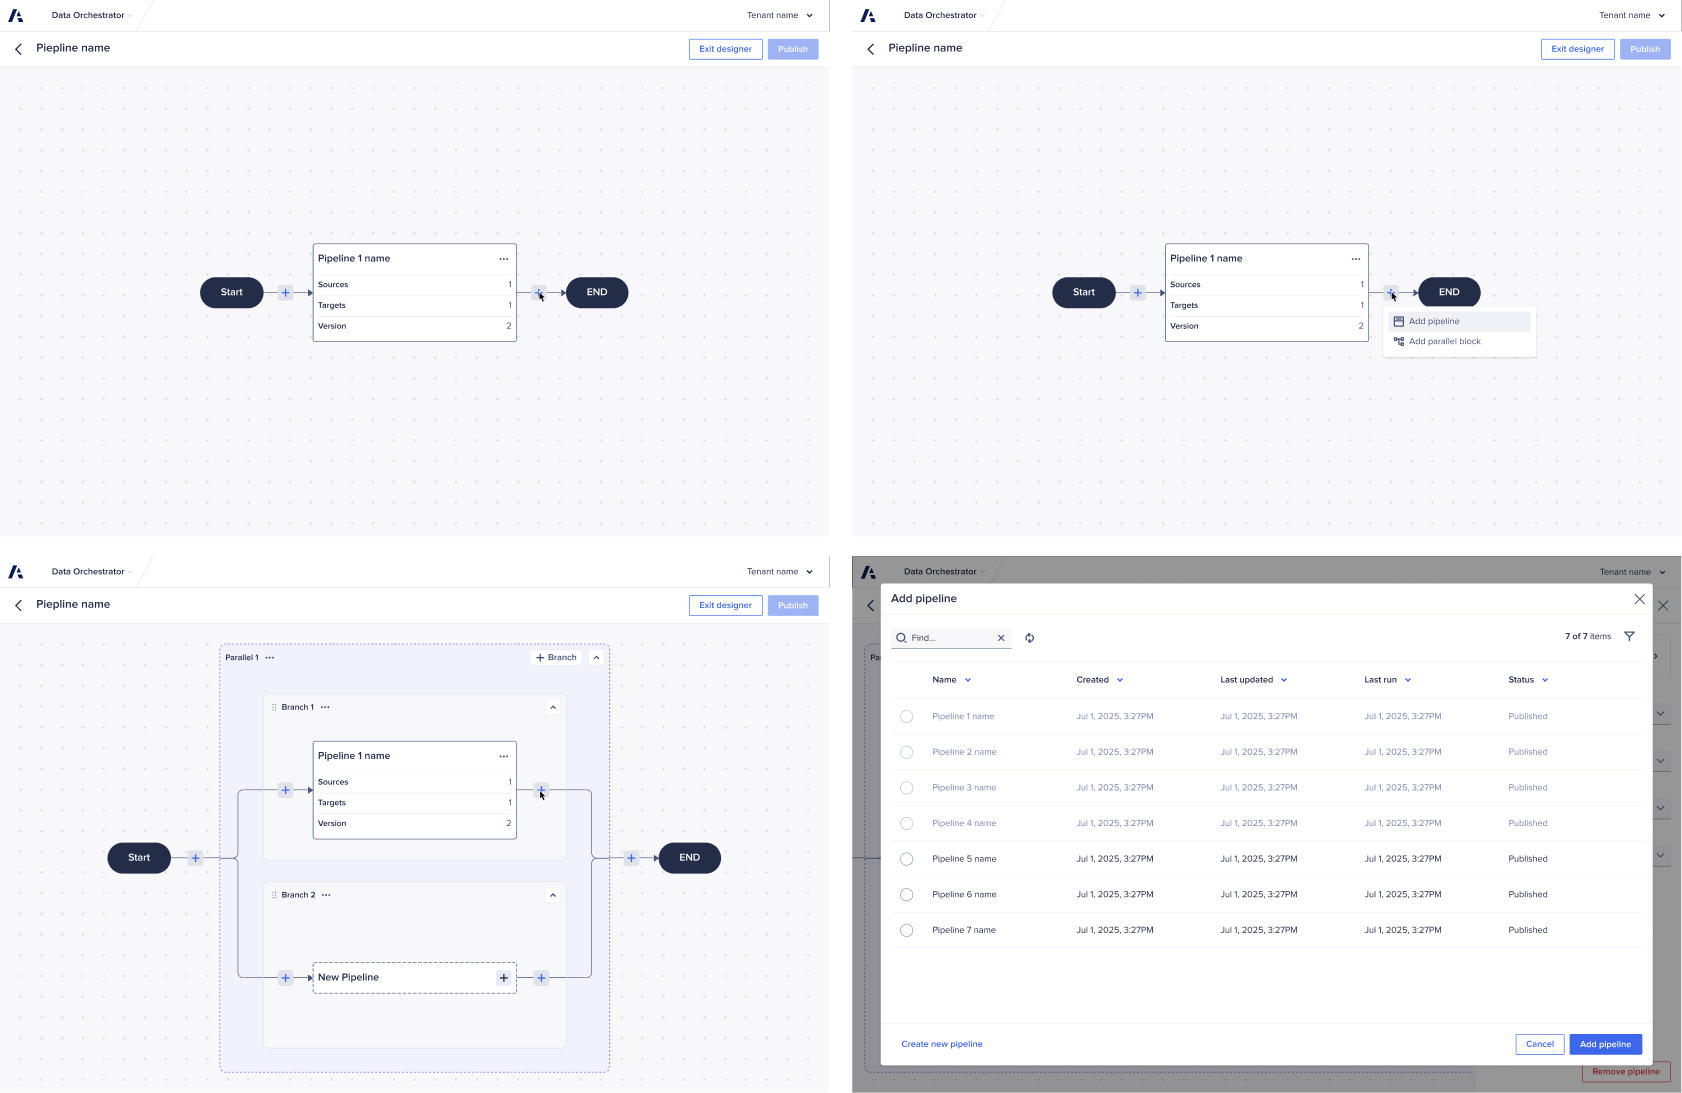
This wasn’t a single scrum team. The project had several. So as lead designer, my job wasn’t only to focus on what I was creating, but also to review what other designers were working on so that we stayed consistent.
This meant regular catch-ups to keep each other in check and ad-hoc workshops when they were needed. It also meant making sure the components we created were easy to share, and that each problem was solved once, so no one duplicated work.
Customers moved to a native tool
As a direct result of this work, several large customers switched from general ETL tools to Anaplan’s own.
This made the core part of Anaplan, modelling, much more efficient in how it handles data, which reduced operating costs.