Spreadsheet analysis tool for Anaplan
Context
The idea of building a spreadsheet analysis tool started as a spin-off to another project. I was working on a project which involved importing spreadsheet documents into Anaplan, a planning application. But within the team, we quickly realised that the flexibility of a spreadsheet made it heavily prone to structural and typo errors. These errors don't tend to affect the experience when working within a spreadsheet software such as Excel but can cause future issues when a user needs to export that data to a more structured database software. So we decided to develop a group of tools capable of analysing a spreadsheet, spotting errors that are not picked up by applications such as Excel and Google Sheets, and even suggesting to users how best to fix them.
Problem analysis and ideation
As the project's team designer, I started by reviewing a wide range of typical spreadsheet documents looking at all the user input errors that could occur but not get picked up by the spreadsheet application.
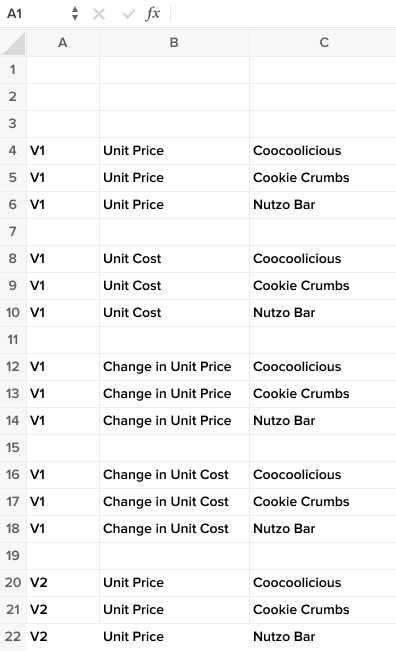
The most typical issue tended to be repeating data typos. This is when users have repeating labels for a piece of data but use various spelling methods. For example, 'Nutzo Bar' in certain places and 'Nutso Bars' in others. This wouldn't be picked up within a spreadsheet document because 'Bar' and 'Bars' are legitimate English words. Plus, labels don't tend to affect formulas. But when using data scraping tools, with such errors, it can result in unintended outcomes. To tackle this, we came up with a counting method allowing both the user and the analysis tool to spot when there are multiple spellings for the same phrase.
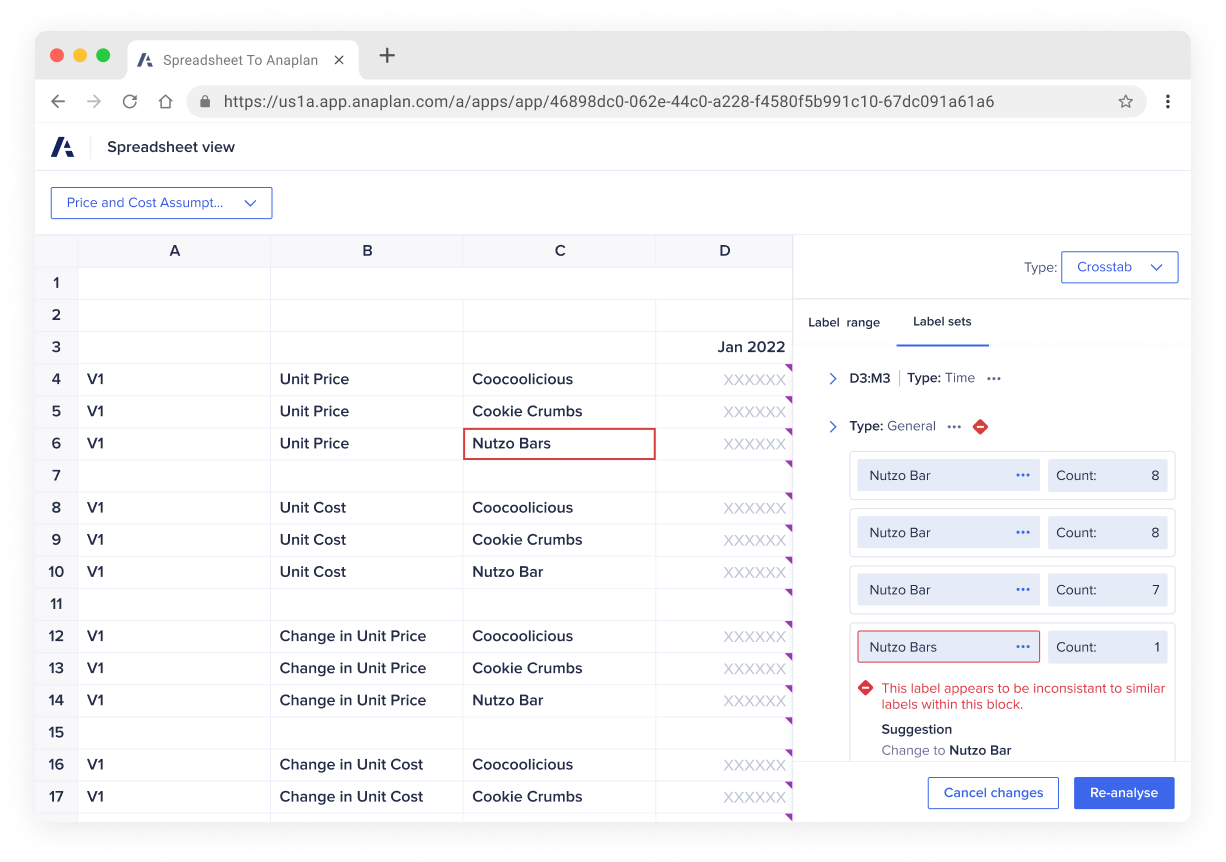
Another typical issue in spreadsheets is having data value with no labels, making it unclear what the data is for. Not only does this make it hard for new users to understand what is happening within tables, but it also makes it hard for scraping tools to know how best to label data. To deal with this, we used existing capabilities within the data scraping tool to spot patterns within the data. But instead of just using those patterns in the backend, we could use them to highlight the data structure to users. That way, spotting missing labels and general structure issues became much easier.

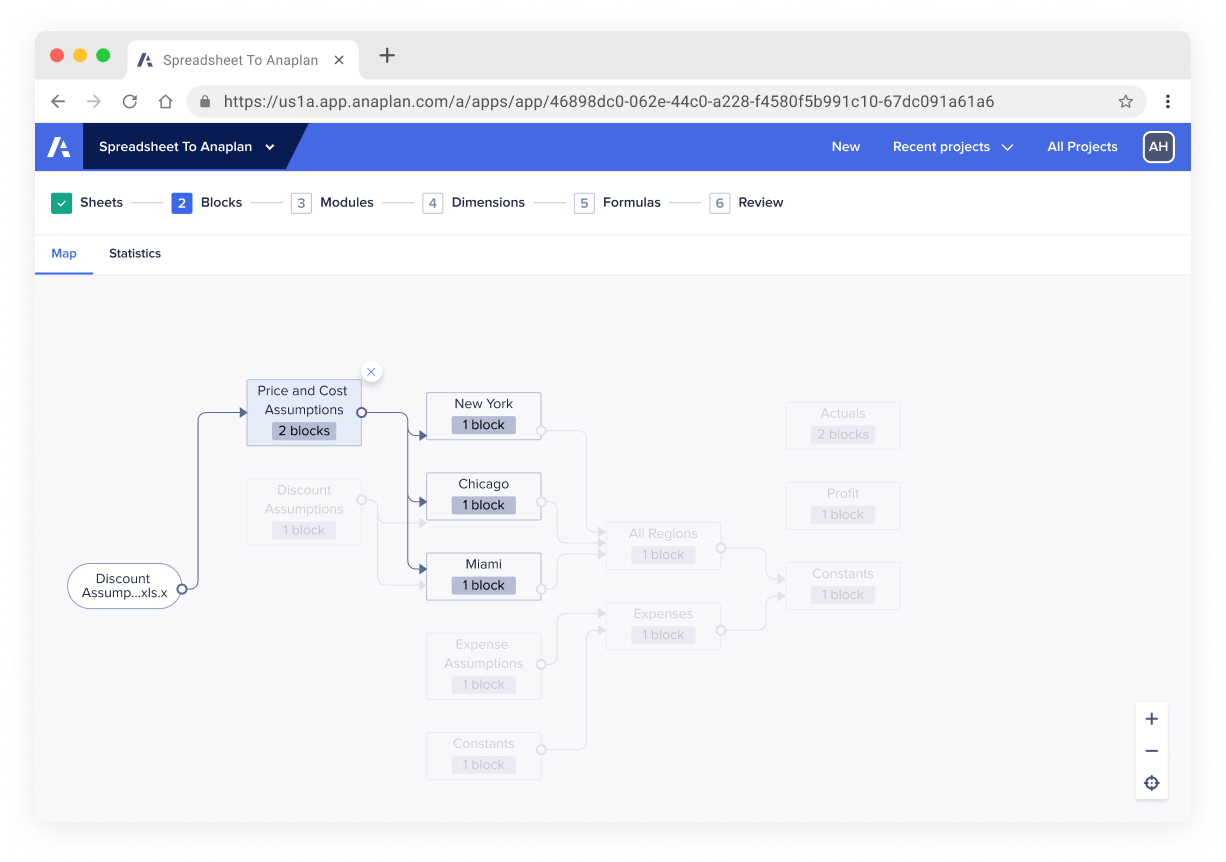
The final issue in spreadsheets was redundant data. Large documents maintained by multiple people caused this. Eventually, a table or even an entire page becomes redundant but remains within the document because no one is sure how it affects the overall data flow. To easily spot redundant data, we developed a spreadsheet data flow diagram to show how data moved between all the pages within a document. That way, we could spot redundant data by looking at pages that weren't contributing to the final table.
Output
As a result of the problem analysis and team ideation, we came up with a set of tools that used AI's power and human intuition to solve problems that couldn't have been solved with either parts missing. And the project became an eye-opener for everyone involved in how to integrate AI into various data management workflows. Also, the tools and features developed within this project ended up adding value to other data management projects within the business.